
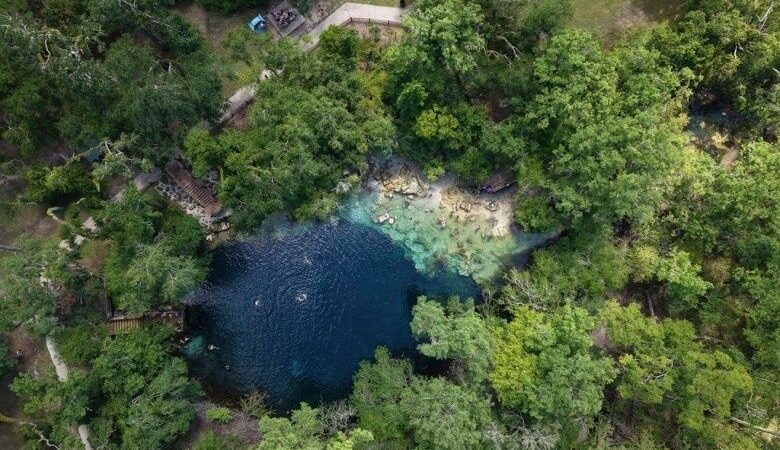
Securing Florida’s Subterranean Backbone
Florida’s groundwater is not merely a scenic feature beneath springs, wetlands, and recreational waterways. The Floridan Aquifer System is critical civil infrastructure, supplying drinking water to almost 10 million people across the southeastern United States and supporting agriculture, industry, ecosystems, and municipal growth. Treating it as an invisible reserve that can absorb unlimited demand is a planning error. It should instead be managed like a continuously monitored utility network, with defined baselines, alarm thresholds, response procedures, and shared operating data.
The security challenge comes from the same geology that makes karst aquifers exceptionally productive. Dissolution in limestone creates fractures, enlarged openings, conduits, and caves that can move water quickly across substantial distances. This rapid connectivity can deliver recharge efficiently, but it can also carry nutrients, pathogens, saline water, or other contaminants with limited natural filtration. Understanding karst aquifer architecture is therefore the first step in building an early-warning system. A practical security model asks three questions: what is normal, which signals indicate deterioration, and how quickly can operators act before a temporary disturbance becomes a permanent loss?
System Architecture of Karst Artesian Flow
The Floridan Aquifer System is a broad sequence of Tertiary carbonate rocks that extends across approximately 100,000 square miles in Florida and parts of Georgia, Alabama, Mississippi, and South Carolina. Its principal divisions are the Upper Floridan aquifer, middle confining and composite units, and Lower Floridan aquifer. The aquifer sequence can exceed 3,000 feet in thickness in south Florida, although the availability and quality of freshwater vary sharply by location. Most freshwater is stored in the Upper Floridan aquifer, while the system becomes brackish in south Florida and the Lower Floridan is commonly saline there.
The Biscayne Aquifer presents a different but closely related operational profile. It is a shallow, highly permeable limestone and carbonate-sand aquifer that serves as the primary drinking-water source in Miami-Dade County. Its near-surface position makes recharge relatively direct, but also leaves it exposed to land-use impacts, canal effects, drought, storms, and pumping pressure. Both systems illustrate a core karst principle: permeability is not evenly distributed. Water does not move through every part of the rock at the same speed. Instead, flow may concentrate in preferential pathways that behave more like underground transmission lines than uniform porous filters.
In a conventional porous medium, groundwater may move slowly through a relatively consistent matrix, allowing greater opportunity for attenuation and observation. In karst, conduit flow can transmit a pulse of water rapidly, particularly after intense rainfall or a recharge event. That makes delayed sampling dangerous. A monitoring well that appears normal after the peak may miss the short-lived signal that revealed a contamination pathway. System architecture should therefore be incorporated into every risk model, including recharge mapping, conduit tracing, well construction review, and the placement of sensors at both source areas and downstream receptors.

- Recharge zones: Areas where rainfall, surface water, or managed recharge enters the aquifer and can carry dissolved pollutants.
- Conduit corridors: Fractures, caves, and enlarged channels that can move water and contaminants much faster than the surrounding rock matrix.
- Confining units: Lower-permeability layers that may separate aquifer zones locally, but should not be assumed to provide uniform protection across a regional system.
- Discharge points: Springs, wells, rivers, and wetlands where changes in groundwater pressure or chemistry become visible.
Three Critical Metrics for Aquifer System Integrity
Effective monitoring begins with a defensible baseline. A single reading rarely identifies a system failure, because groundwater levels, spring flows, conductivity, and nitrate concentrations naturally respond to rainfall, drought, seasonal demand, and storm events. The useful signal comes from comparing current observations with historical ranges, nearby reference sites, and known hydrologic conditions. The objective is not to eliminate variability, but to distinguish expected variability from a sustained or geographically coherent change.
Spring discharge is one of the clearest pressure indicators. Florida’s first-magnitude classification begins at 100 cubic feet per second, but even large springs can fluctuate substantially with climate and aquifer conditions. The Silver Springs group, for example, has an average discharge of roughly 796 cubic feet per second, while long-term observations show that nitrate-N concentrations in Main Spring water increased from less than 0.5 milligrams per liter in the 1960s to about 1.0 milligram per liter in 2003. A decline in discharge, especially when it persists beyond normal drought response, can indicate reduced hydraulic head, increased withdrawals, or altered recharge. A simultaneous rise in nitrate or conductivity is more concerning than either signal alone.
Nitrate-N is a particularly useful contamination indicator because fertilizers, animal waste, wastewater, septic systems, and atmospheric deposition can all contribute nitrogen to groundwater. In the Santa Fe River Basin, restoration planning has targeted nitrate concentrations below 0.35 milligrams per liter, while monitoring has shown that rainfall and dilution can influence concentrations independently of land-use change. This is an important operational caution. A falling concentration does not automatically prove that loading has been reduced, and a short-term rise should be interpreted alongside rainfall, groundwater age, pumping, and recharge conditions.
| Metric type | Normal baseline | Critical risk signals |
|---|---|---|
| Hydraulic head and spring discharge | Seasonal range established from multi-year records and comparable reference stations | Sustained low heads, declining spring magnitude, or a flow reduction not explained by rainfall and drought |
| Nitrate-N concentration | Stable site-specific range linked to land use, recharge, and seasonal conditions | Rapid increase, repeated threshold exceedance, or a new plume moving toward a wellfield or spring |
| Specific conductance and chloride | Freshwater conductivity and chloride profile appropriate to the site | Persistent upward trend, saline pulse, or inland movement of the saltwater interface |
| Clarity and turbidity | Normal response to rainfall and recharge events | Unusual turbidity duration, repeated post-storm degradation, or declining clarity without a natural explanation |
Long-term records are essential because they reveal whether an apparent anomaly is isolated or part of a regional shift. The USGS National Ground-Water Monitoring Network combines federal, state, and local observations of water levels, water quality, lithology, and well construction. Its categories for background, suspected changes, and documented changes provide a useful model for municipal monitoring programs. Operators should preserve raw readings, calibration records, timestamps, and weather context so that trend analysis remains credible during regulatory review or an emergency response.
Perimeter Threats from Extraction and Saltwater Intrusion
Coastal saltwater intrusion is a boundary-control problem. Fresh groundwater normally exerts pressure that helps hold denser seawater near the coast. Excessive pumping, canal drainage, drought, and reduced recharge lower that pressure and allow saline water to move inland or upward into freshwater zones. The effect may not appear first at the production well. A monitoring site closer to the coast or within a vulnerable conduit may detect the shift months or years earlier.
The Biscayne Aquifer demonstrates how quickly a coastal perimeter can change. A USGS assessment of Miami-Dade County mapped the saltwater interface using a 1,000-milligram-per-liter chloride isochlor and found that, between 2018 and 2022, the interface advanced inland by as much as 0.3 kilometer in northern Miami-Dade County and up to 0.8 kilometer in the southern Model Land Area. The movement was not uniform, which reinforces the need for local monitoring rather than broad assumptions about regional stability.
Internal recharge basins face a different risk profile. They may be farther from the coastline and less directly exposed to saline wedges, but shallow, unconfined sections can be highly vulnerable to nitrate, pathogens, and other surface-derived contaminants. Municipal wellfields and agricultural irrigation systems can also lower artesian pressure across a wider area than the pumping site itself. A defensible risk assessment should distinguish coastal salinity risk from inland contamination risk, while recognizing that both can be intensified by drawdown and drought.
- Coastal zones: Track chloride, specific conductance, water levels, canal stages, and the position of the freshwater-saltwater interface.
- Recharge basins: Track nitrate, turbidity, microbial indicators where appropriate, rainfall, land use, and rapid post-storm changes.
- Municipal wellfields: Compare pumping schedules with head declines, spring discharge, and nearby monitoring-well responses.
- Agricultural areas: Evaluate irrigation withdrawals, fertilizer timing, drainage infrastructure, and seasonal recharge pulses together rather than in isolation.
The Aquifer Defense Protocol for Municipal and Industrial Operators
A response protocol should turn measurements into decisions. Monitoring without predefined action levels produces data but not protection. Municipal and industrial operators should establish site-specific thresholds through hydrogeological modeling, historical records, regulatory requirements, and consultation with water-management districts. Thresholds must account for uncertainty, because waiting for absolute proof can allow a saline front or contaminant plume to pass a point where reversal becomes expensive or technically impractical.
Real-time instrumentation can improve response speed, but it does not remove the need for laboratory confirmation and quality assurance. Continuous conductivity and water-level sensors can identify a developing saline or drawdown signal, while automated nitrate analyzers or frequent grab samples can detect nutrient changes. Data should flow into a dashboard that displays current conditions against seasonal baselines, flags missing or implausible readings, and preserves an auditable record. The USGS Florida groundwater data tools provide a useful reference for building historical time series and comparing current observations with prior conditions.
- Confirm the signal. Check sensor calibration, duplicate measurements, well integrity, recent rainfall, nearby pumping, and the possibility of electrical or sampling error.
- Classify the threat. Determine whether the signal indicates hydraulic stress, nitrate loading, turbidity, salinity, or a combined event, then map its likely source and direction of movement.
- Reduce immediate pressure. Adjust pumping rates, rotate production wells, increase reliance on alternative supplies, or temporarily suspend a suspected source where operationally feasible.
- Expand the monitoring perimeter. Sample upgradient and downgradient wells, recharge features, canals, springs, and nearby surface waters to determine whether the signal is local or regional.
- Escalate and document. Notify the relevant water-management district and public-health or environmental authorities, preserve chain-of-custody records, and communicate verified conditions without overstating uncertain findings.
Low-head warnings deserve particular attention because pumping decisions made during regional stress can determine whether a system recovers after rainfall or crosses into a prolonged decline. A practical trigger may combine several observations, such as water levels below a defined percentile, spring discharge falling faster than expected, and rising conductivity near a coastal wellfield. The exact threshold will differ by basin, but the operating principle is consistent: intervene on a strong leading signal, not only after drinking-water quality has already failed.
Building Long-Term Resilience in Subterranean Infrastructure
A security-first aquifer strategy changes the management question from “How much water remains?” to “Which conditions show that the system is losing resilience?” That shift places equal weight on water quantity, water quality, pressure, connectivity, and recovery time. It also recognizes that the same karst features that deliver high yields can shorten the warning period after a surface disturbance or pumping change.
- Maintain multi-year hydraulic and water-quality baselines at regional and wellfield scales.
- Use continuous telemetry for head, conductivity, temperature, turbidity, and other locally justified indicators.
- Pair automated alerts with human review, laboratory confirmation, and documented escalation rules.
- Model coastal boundaries, recharge zones, springs, canals, and production wells as one connected risk network.
- Share standardized data across municipal, agricultural, industrial, academic, and regulatory boundaries.
Rapid diagnostic action is not a substitute for conservation, land-use controls, recharge protection, or demand management. It is the mechanism that allows those measures to work before damage becomes entrenched. A unified, cross-regional monitoring standard for Florida’s karst aquifers would give managers a common language for normal conditions, emerging threats, and emergency response. The aquifer may be underground, but its protection requires visible accountability, interoperable data, and decisions made early enough to preserve the next several decades of water security.